Table of Contents
In this dynamic environment, staying ahead of the competition demands more than just an exceptional product – it demands data-driven decision-making. For this, understanding the vital metrics that underpin the success of your SaaS venture is not just an advantage – it’s an absolute necessity. Here are the top 10 SaaS metrics that will not only empower you with actionable insights but also reshape the trajectory of your SaaS venture, ensuring unparalleled growth and success in this fast-paced digital era.
Let’s explore!
What are SaaS metrics?
SaaS metrics are specific key performance indicators (KPIs) that provide valuable insights into various aspects of your SaaS product and its customer base. These metrics are crucial in evaluating the health of your business, identifying strengths and weaknesses, and making data-driven decisions to drive sustainable growth.

Guide To Software Product Development By Experts [eBook]
Get your free copy
Top 10 Must Know SaaS Metrics
- Monthly Recurring Revenue (MRR)
- Churn Rate
- Customer Acquisition Cost (CAC)
- Customer Lifetime Value (CLV)
- Average Revenue Per User (ARPU)
- Customer Engagement Metrics
- Gross Margin
- Customer Satisfaction (CSAT) and Net Promoter Score (NPS)
- Trial Conversion Rate
- Expansion Revenue
1) Monthly Recurring Revenue (MRR)
MRR represents the predictable and recurring revenue generated from active subscriptions on a monthly basis. It is a crucial metric for tracking revenue stability and growth. To calculate Monthly Recurring Revenue (MRR) for a SaaS product, follow these steps:
- Identify Subscription Plans: Determine the different subscription plans offered by your SaaS product. This could include various tiers or packages with different features, pricing, and billing cycles.
- Count Active Subscribers: For each subscription plan, count the number of active subscribers during a specific period, typically a month. Active subscribers are customers who are actively using the service and have not canceled or churned.
- Calculate Monthly Revenue per Plan: Multiply the number of active subscribers for each plan by the corresponding monthly subscription fee. This will give you the monthly revenue generated from each plan.
- Sum the Monthly Revenues: Add up the monthly revenues from all subscription plans to get the total Monthly Recurring Revenue (MRR) for the given period.
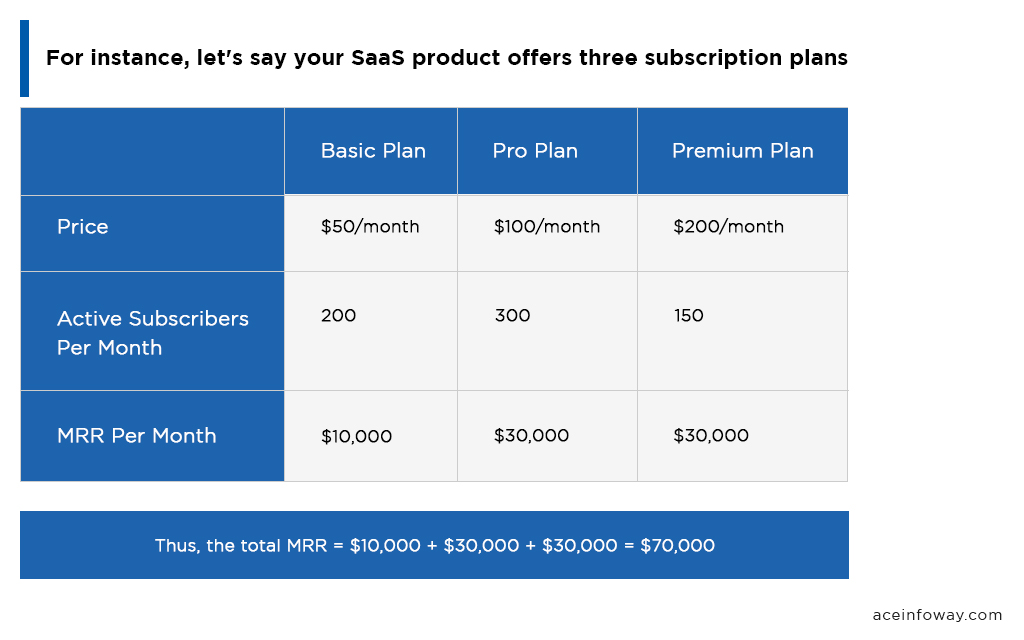
Monitoring MRR on an ongoing basis is crucial for SaaS businesses as it provides a clear understanding of revenue trends, growth patterns, and the impact of pricing changes or marketing efforts.
2) Churn Rate
Churn rate measures the percentage of customers who cancel or unsubscribe from your service within a specific time period. A high churn rate can indicate dissatisfaction or retention issues. To calculate the Churn Rate for a SaaS product, follow these steps:
- Define the Time Period: Determine the specific time period for which you want to calculate the churn rate. This could be a month, quarter, or any other defined interval.
- Count Customers at the Start: At the beginning of the chosen time period, count the number of active customers or subscribers.
- Count Customers Lost: Identify the customers who have churned or canceled their subscriptions during the selected time period.
- Calculate Churn Rate: Divide the number of customers lost during the chosen time period by the number of customers at the start of the period, then multiply by 100 to express the churn rate as a percentage.

By analyzing churn rate trends over time, companies can identify potential issues or pain points in their product or service, take proactive measures to improve customer retention and implement strategies to reduce churn. Lowering the churn rate is essential for sustainable growth and profitability in the competitive SaaS market, making Churn Rate an indispensable metric for SaaS professionals.
3) Customer Acquisition Cost (CAC)
CAC calculates the average cost of acquiring a new customer. Understanding CAC helps product owners evaluate the effectiveness of their marketing and sales efforts. To calculate Customer Acquisition Cost for a SaaS product, follow these steps:
- Identify Marketing and Sales Expenses: Gather all the expenses associated with marketing and sales efforts aimed at acquiring new customers. This includes costs related to advertising, content creation, social media campaigns, events, sales team salaries, commissions, and any other relevant expenses.
- Define the Time Period: Determine the specific time period for which you want to calculate CAC. Common time periods used are monthly or annually.
- Count New Customers: Count the number of new customers acquired during the chosen time period.
- Calculate Customer Acquisition Cost: Divide the total marketing and sales expenses by the number of new customers acquired during the selected time period.

Analyzing CAC helps SaaS businesses assess the effectiveness of their customer acquisition strategies. A high CAC may indicate that marketing and sales efforts are too expensive and need optimization, while a low CAC might suggest an opportunity to invest more in marketing to drive further growth. By keeping CAC in check and comparing it with other metrics like Customer Lifetime Value (CLV), SaaS companies can ensure that their customer acquisition efforts remain sustainable and contribute to the overall profitability and success of the business.
4) Customer Lifetime Value (CLV)
CLV estimates the total revenue a customer is expected to generate during their entire relationship with your company. It helps prioritize customer retention and identify valuable customer segments. To calculate Customer Lifetime Value for a SaaS product, follow these steps:
- Identify the Time Period: Determine the specific time period you want to analyze for CLV calculation. This could be monthly, annually, or the average duration of customer relationships.
- Calculate Average Revenue per Customer: Sum up the total revenue generated from a specific customer segment during the chosen time period, then divide it by the total number of customers in that segment.
- Calculate Average Customer Lifespan: Determine the average length of time a customer stays subscribed or engaged with your SaaS product. This is typically calculated by tracking the customer tenure and calculating the average.
- Calculate Customer Lifetime Value: Multiply the Average Revenue per Customer by the Average Customer Lifespan.
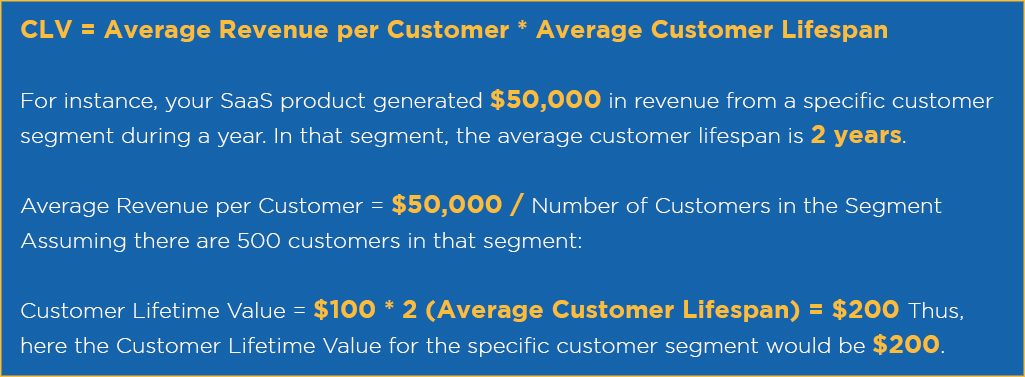
Analyzing CLV helps SaaS businesses identify their most valuable customer segments and tailor marketing and customer retention strategies accordingly. By maximizing CLV, companies can increase revenue per customer, improve customer loyalty, and optimize their business for sustainable growth. It also aids in decision-making regarding customer acquisition costs, as it provides insights into the potential long-term return on investment for acquiring new customers.
5) Average Revenue Per User (ARPU)
ARPU measures the average revenue generated per individual customer. Monitoring ARPU can help product owners identify upsell or cross-sell opportunities. To calculate Average Revenue Per User (ARPU) for a SaaS product, follow these steps:
- Identify the Time Period: Determine the specific time period for which you want to calculate ARPU. This could be monthly, quarterly, or annually.
- Calculate Total Revenue: Sum up the total revenue generated by the SaaS product during the chosen time period.
- Count the Active Users: Count the number of active users or customers who used the SaaS product during the selected time period. Active users are those who have engaged with the product and may include both paying customers and free trial users.
- Calculate Average Revenue Per User: Divide the total revenue by the number of active users.
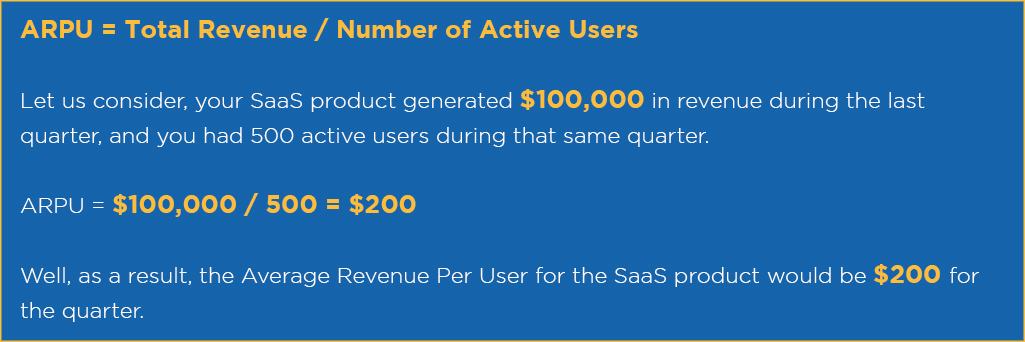
Analyzing ARPU helps SaaS businesses understand the revenue contribution of individual users, track revenue trends over time, and compare the value generated by different customer segments. It also assists in assessing the effectiveness of pricing strategies and identifying opportunities for upselling or cross-selling to increase ARPU. By monitoring ARPU, SaaS companies can optimize their product offerings and marketing efforts to maximize revenue per user, thus driving overall growth and profitability in the competitive SaaS market.
6) Customer Engagement Metrics
These include metrics like Daily Active Users (DAU) and Monthly Active Users (MAU), which gauge how often customers use your product. Engaged users are more likely to convert and stay loyal. To track Customer Engagement Metrics for a SaaS product, consider the following KPIs and their technical details:
- Active Users: Active Users measure the number of unique customers who have interacted with the SaaS product within a specific time period, such as a day, week, or month.
- Time on Platform: This metric tracks the average time customers spend using the SaaS product during a session or within a defined period, indicating the level of engagement and interest in the platform.
- Feature Adoption Rate: Feature Adoption Rate measures the percentage of active users who have used specific features or functionalities of the SaaS product. It helps assess the effectiveness of product features and identify underutilized functionalities.
- Session Length: Session Length refers to the duration of each customer’s interaction with the SaaS product during a single session, helping to understand user engagement and user experience.
- Click-Through Rate (CTR): CTR measures the percentage of users who clicked on a specific call-to-action or link within the product, indicating user interest and interaction with particular elements.
- Conversion Rate: Conversion Rate calculates the percentage of users who completed a specific action, such as signing up for a free trial, upgrading their subscription, or making a purchase. It reflects the effectiveness of the product in driving desired actions.
- Customer Feedback and Surveys: Collecting customer feedback through surveys or in-app feedback tools provide qualitative insights into user satisfaction and areas for improvement.
- Customer Support Interactions: Tracking the number and nature of customer support interactions, such as tickets or chats, helps understand pain points and the level of customer satisfaction.
To perform Customer Engagement Metrics analysis for a SaaS product:
- Use Analytics Tools: Implement analytics tools like Google Analytics, Mixpanel, or Amplitude to collect relevant data on user behavior and engagement within the SaaS product.
- Set Clear Goals: Define specific goals for each engagement metric to align them with business objectives and measure success accurately.
- Monitor Regularly: Regularly review and analyze the engagement metrics over time to identify trends, patterns, and areas of improvement.
By monitoring and analyzing Customer Engagement Metrics, SaaS businesses can gain insights into user behavior, optimize their product to meet customer needs and foster long-term customer loyalty and satisfaction. These metrics play a pivotal role in enhancing the overall user experience and driving sustainable growth in the competitive SaaS market.
7) Gross Margin
Gross margin calculates the difference between the revenue generated and the cost of goods sold. Understanding gross margins is crucial for assessing the profitability of your SaaS business. To calculate Gross Margin for a SaaS product, follow these steps:
Identify Total Revenue: Sum up all the revenue generated by the SaaS product during a specific time period. This includes revenue from subscription fees, one-time purchases, or any other sources.
Determine Cost of Goods Sold (COGS): For a SaaS product, COGS mainly includes the expenses directly related to delivering the service, such as hosting costs, server expenses, licensing fees for third-party software, and customer support costs.
Calculate Gross Profit: Subtract the COGS from the Total Revenue to obtain the Gross Profit.
Calculate Gross Margin: Divide the Gross Profit by the Total Revenue and multiply by 100 to express the Gross Margin as a percentage.
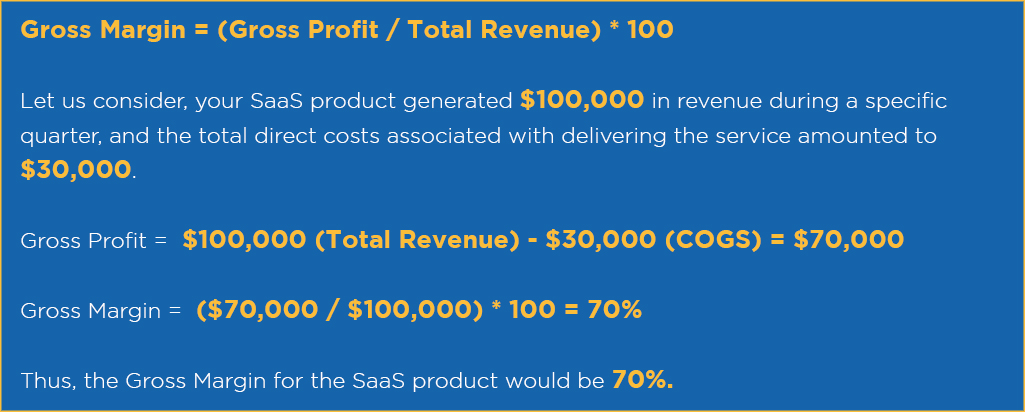
A higher Gross Margin indicates that the SaaS product is generating more revenue than it incurs in direct costs, which is a positive sign for the company’s financial health. On the other hand, a low Gross Margin may suggest the need to optimize costs or pricing strategies to improve profitability. By analyzing Gross Margin regularly, SaaS companies can make informed decisions about pricing, resource allocation, and overall business strategies to achieve sustained growth and success in the competitive SaaS market.
8) Customer Satisfaction (CSAT) and Net Promoter Score (NPS)
CSAT and NPS are both essential in measuring customer satisfaction and loyalty. Satisfied customers are more likely to renew subscriptions and recommend your product. To measure Customer Satisfaction (CSAT) for a SaaS product, follow these steps:
- Select a Sample: Choose a representative sample of customers who have recently interacted with your SaaS product or customer support.
- Create a Survey: Design a survey with a standardized set of questions to assess customer satisfaction. The survey can include questions like “How satisfied are you with our product/service?” with answer options like “Very Satisfied,” “Satisfied,” “Neutral,” “Dissatisfied,” or “Very Dissatisfied.”
- Calculate CSAT Score: Calculate the CSAT score by dividing the number of satisfied customers (those who answered “Satisfied” or “Very Satisfied”) by the total number of respondents and multiplying by 100 to express it as a percentage.
CSAT Score = (Number of Satisfied Customers / Total Number of Respondents) * 100
To measure Net Promoter Score (NPS) for a SaaS product, follow these steps:
- Create a Survey: Design a simple survey with a single question: “On a scale of 0 to 10, how likely are you to recommend our product/service to a friend or colleague?”
- Segment Responses: Categorize respondents into three groups based on their rating:
- Promoters (score 9-10): Customers who are highly likely to recommend.
- Passives (score 7-8): Customers who are somewhat satisfied but may not actively promote.
- Detractors (score 0-6): Customers who are not likely to recommend and may have negative feedback.
- Calculate NPS: Subtract the percentage of Detractors from the percentage of Promoters to obtain the Net Promoter Score.
NPS = Percentage of Promoters – Percentage of Detractors
- NPS above 0: Indicates more Promoters than Detractors and generally positive customer sentiment.
- NPS above 50: Suggests strong customer loyalty and advocacy.
- NPS below 0: Implies more Detractors than Promoters and a need for improvement.
These metrics empower companies to build stronger customer relationships, drive positive word-of-mouth, and foster sustainable growth in the competitive SaaS market.
9) Trial Conversion Rate
This metric tracks the percentage of trial users who convert into paying customers. A high trial conversion rate indicates a strong product-market fit and effective onboarding. To calculate Trial Conversion Rate for a SaaS product, follow these steps:
- Identify the Time Period: Determine the specific time period for which you want to calculate the trial conversion rate. This could be a month, quarter, or any other defined interval.
- Count Trial Sign-ups: Count the number of users who signed up for a free trial or used the freemium offering during the chosen time period.
- Count Paying Customers: Identify the number of trial users who converted into paying customers by the end of the same time period.
- Calculate Trial Conversion Rate: Divide the number of paying customers by the number of trial sign-ups and multiply by 100 to express the trial conversion rate as a percentage.
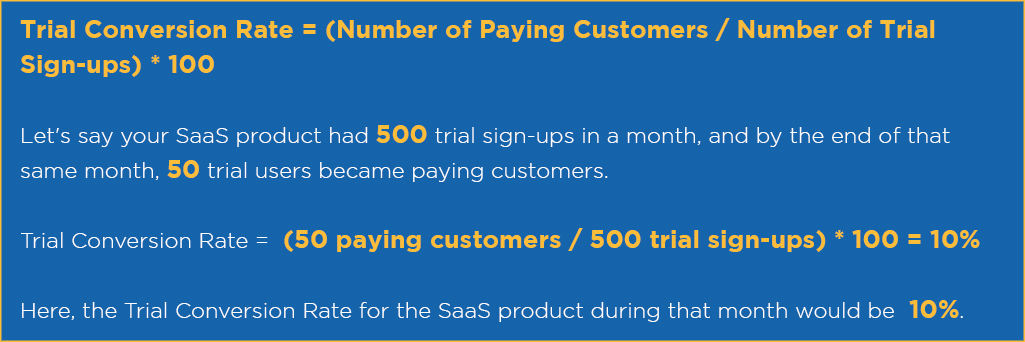
A high trial conversion rate indicates that the product resonates well with trial users and effectively showcases its value during the trial period. On the other hand, a low trial conversion rate may suggest that adjustments are needed in the trial experience or product offering to better convince users to become paying customers.
10) Expansion Revenue
Expansion revenue includes revenue from upselling, cross-selling, or expanding the usage of your product with existing customers. It is vital for driving revenue growth without relying solely on new customer acquisition. To calculate Expansion Revenue for a SaaS product, follow these steps:
- Identify Expansion Opportunities: Identify the opportunities within your SaaS product to upsell or cross-sell additional features, plans, or upgrades to existing customers.
- Segment Customers: Categorize your existing customers based on their current subscription plan or usage level.
- Track Revenue Changes: Monitor changes in the revenue generated by each customer segment over a specific time period, typically monthly.
- Calculate Expansion Revenue: Calculate the difference between the current revenue from each customer segment and the previous revenue from the same segment. The positive difference represents the Expansion Revenue generated from that segment.
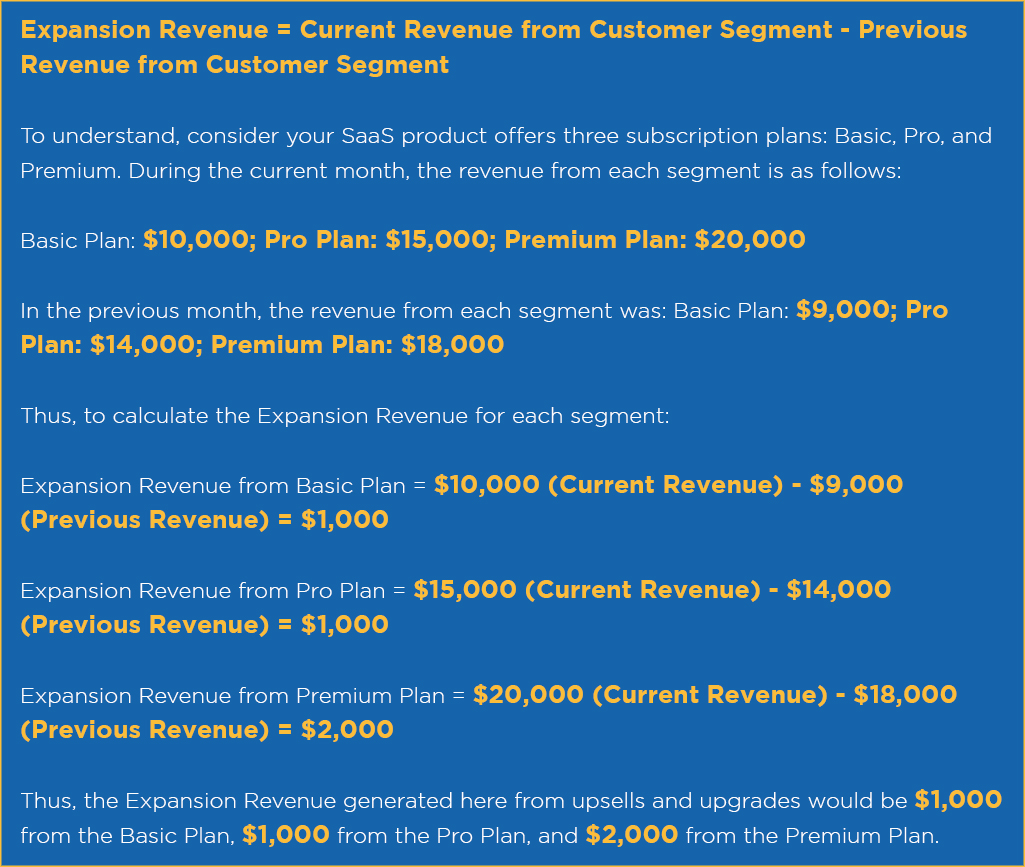
Monitoring Expansion Revenue is vital for SaaS businesses as it helps identify growth opportunities from the existing customer base, optimize pricing and upsell strategies, and maximize the revenue potential from current clients. By focusing on expansion, SaaS companies can achieve sustainable growth and increased profitability in the dynamic and competitive SaaS market.
Conclusion
Remember, it’s not just about having a remarkable product, but also about utilizing data to continuously improve and stay ahead of the competition. By monitoring these SaaS metrics, you can gain valuable insights into the health of your SaaS business, make informed decisions, and steer your company toward sustainable growth and profitability.
As you embark on this data-driven journey, we invite you to take your SaaS venture to new heights with our cutting-edge SaaS services. Don’t miss the chance to elevate your SaaS business to its full potential. Contact us today and let’s embark on this exciting journey together!


